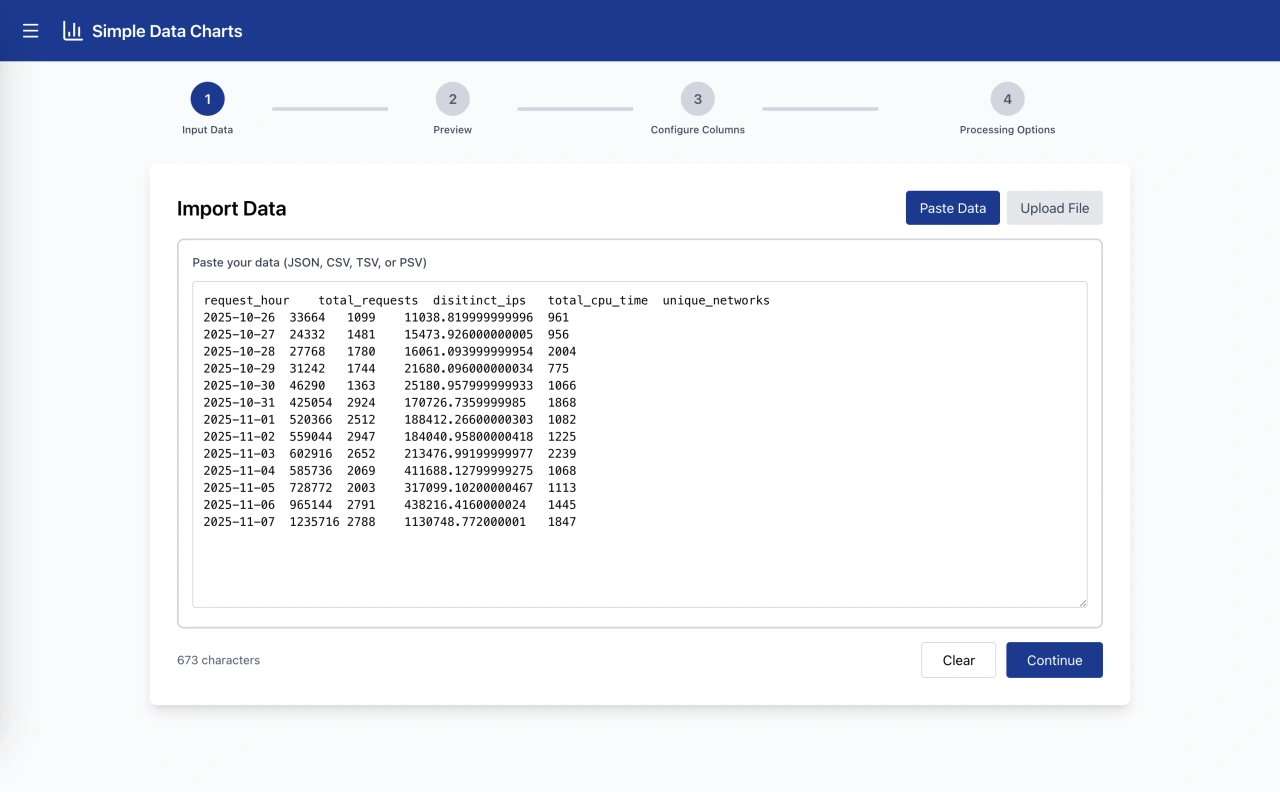
Start with Your Data
Copy data from Excel, Google Sheets, or any text source. Or upload a file. We'll automatically detect the format and get you started in seconds.
- Paste directly from spreadsheets, databases, or text files
- Upload files in multiple formats (JSON, CSV, TSV, PSV)
- Auto-format detection—we figure out your data structure
- Instant validation—know immediately if your data works
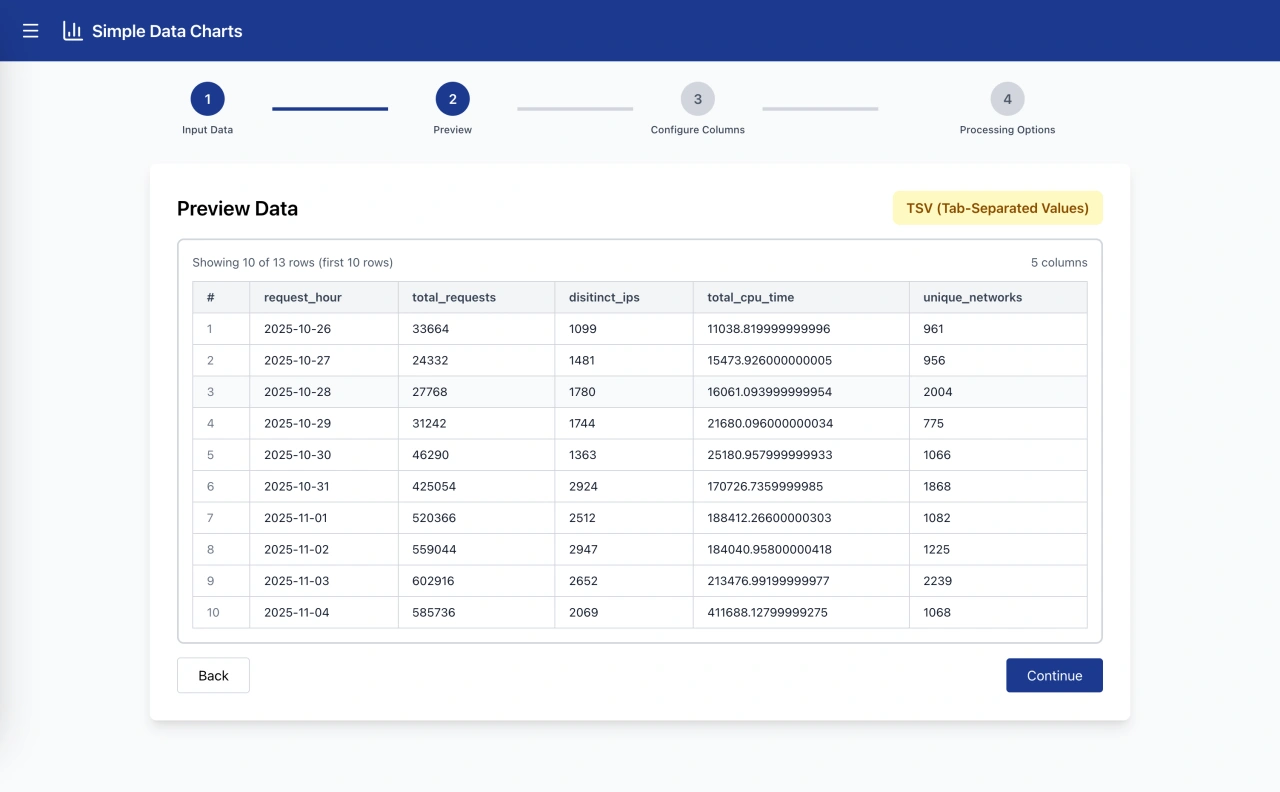
Verify Your Import
See exactly how your data was parsed. Wrong format detected? Just select the correct one from the dropdown and the preview updates instantly.
- Live preview of parsed data (first 10 rows)
- Format override—manually select CSV, TSV, PSV, or JSON
- Column count and row count at a glance
- Validate before proceeding to configuration
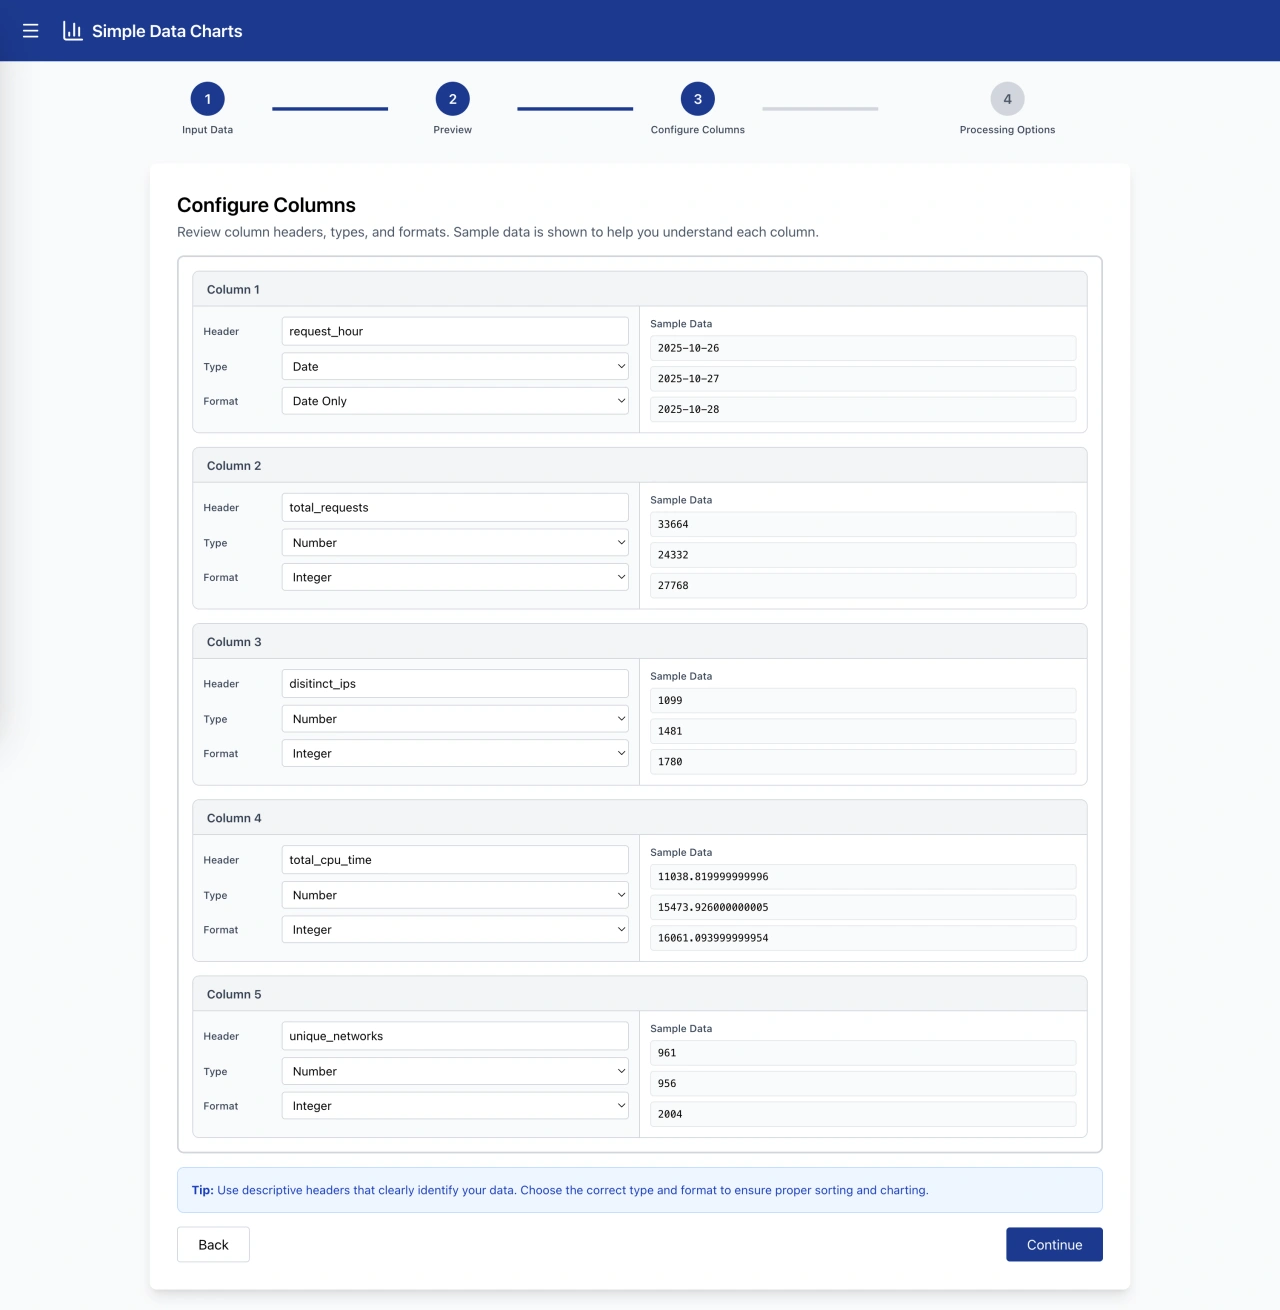
Configure Your Data Structure
Fine-tune your data with an intuitive interface. See sample values as you configure types and formats. Everything updates in real-time.
- Edit column headers—rename for clarity
- Set data types—Text, Number, or Date
- Choose formats—Currency, Percentage, Timestamps, and more
- Sample data preview—see actual values while configuring
- Type auto-detection—smart defaults save time
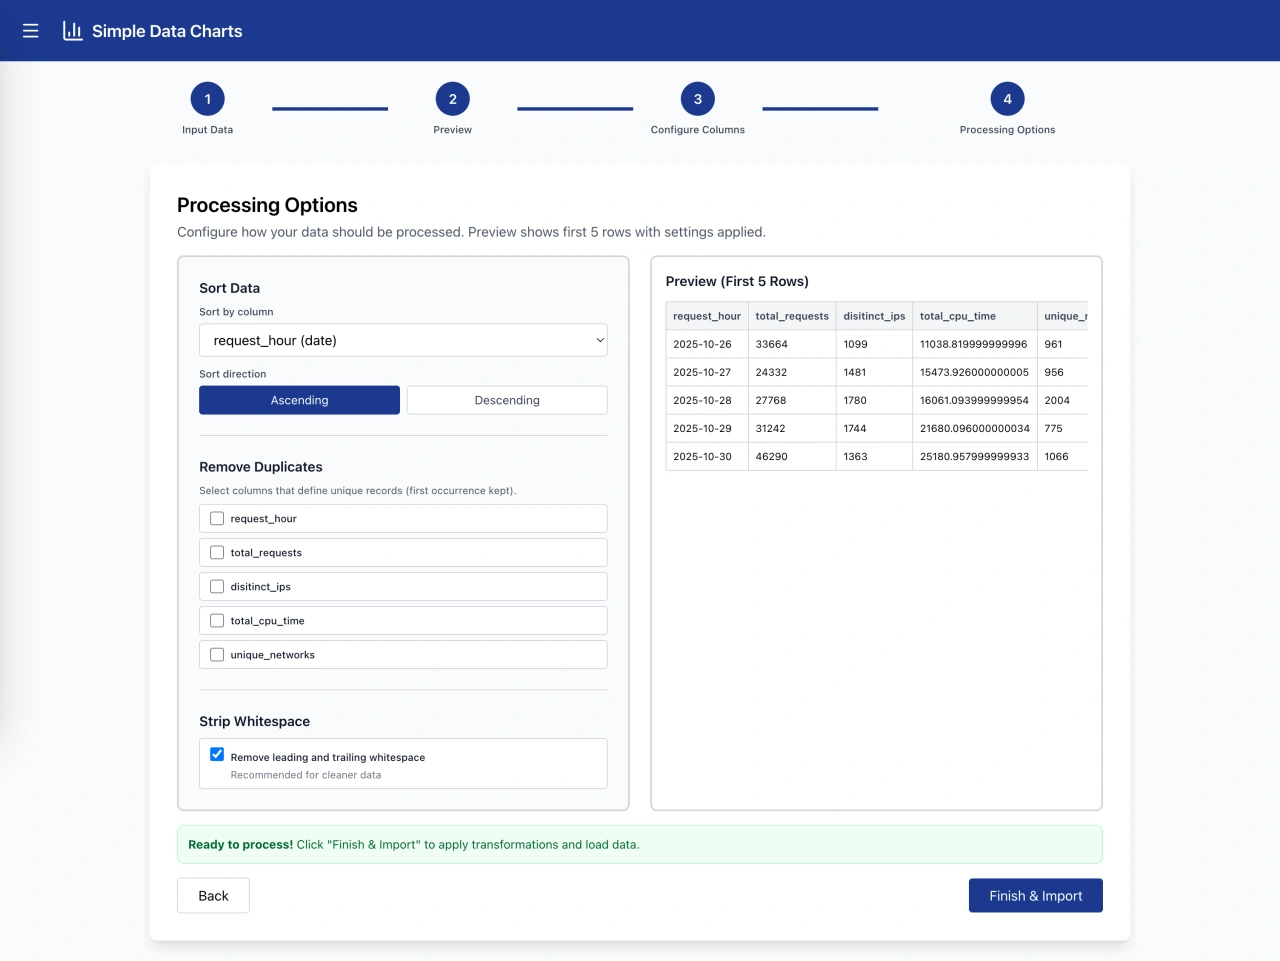
Transform Your Data
Clean and organize your data with powerful processing options. The live preview shows exactly what you'll get before you commit.
- Sort by any column—ascending or descending
- Remove duplicates—select key columns for deduplication
- Strip whitespace—clean up messy data automatically
- Live preview—see transformations before applying
- One-time processing—optimal performance
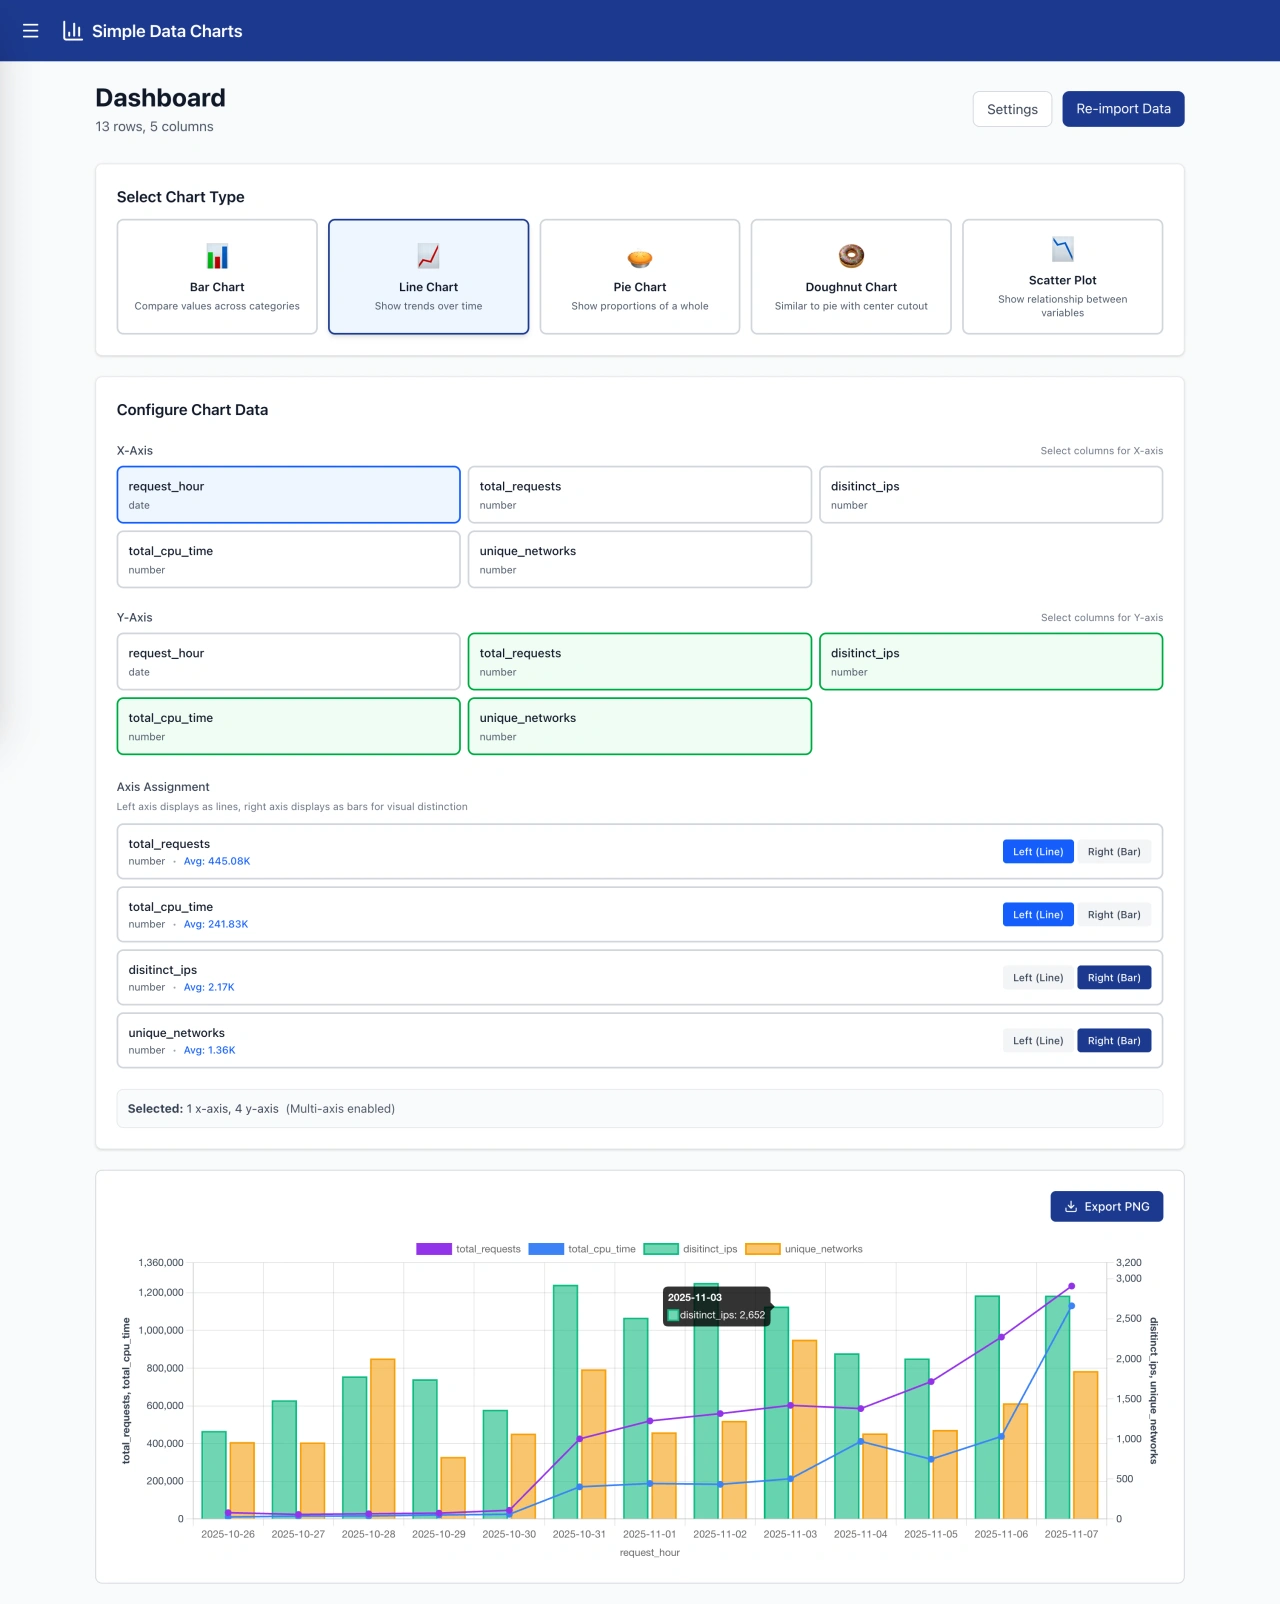
Visualize Your Insights
Choose your chart type and select columns. For advanced visualizations, use multi-axis charts to compare metrics with vastly different scales—like temperature and revenue.
- 5 chart types: Bar, Line, Pie, Doughnut, Scatter
- Multi-axis line charts—compare metrics with different scales
- Mixed chart types—lines and bars in one chart
- Smart axis scaling—automatic optimal ranges
- Interactive tooltips—hover for detailed values
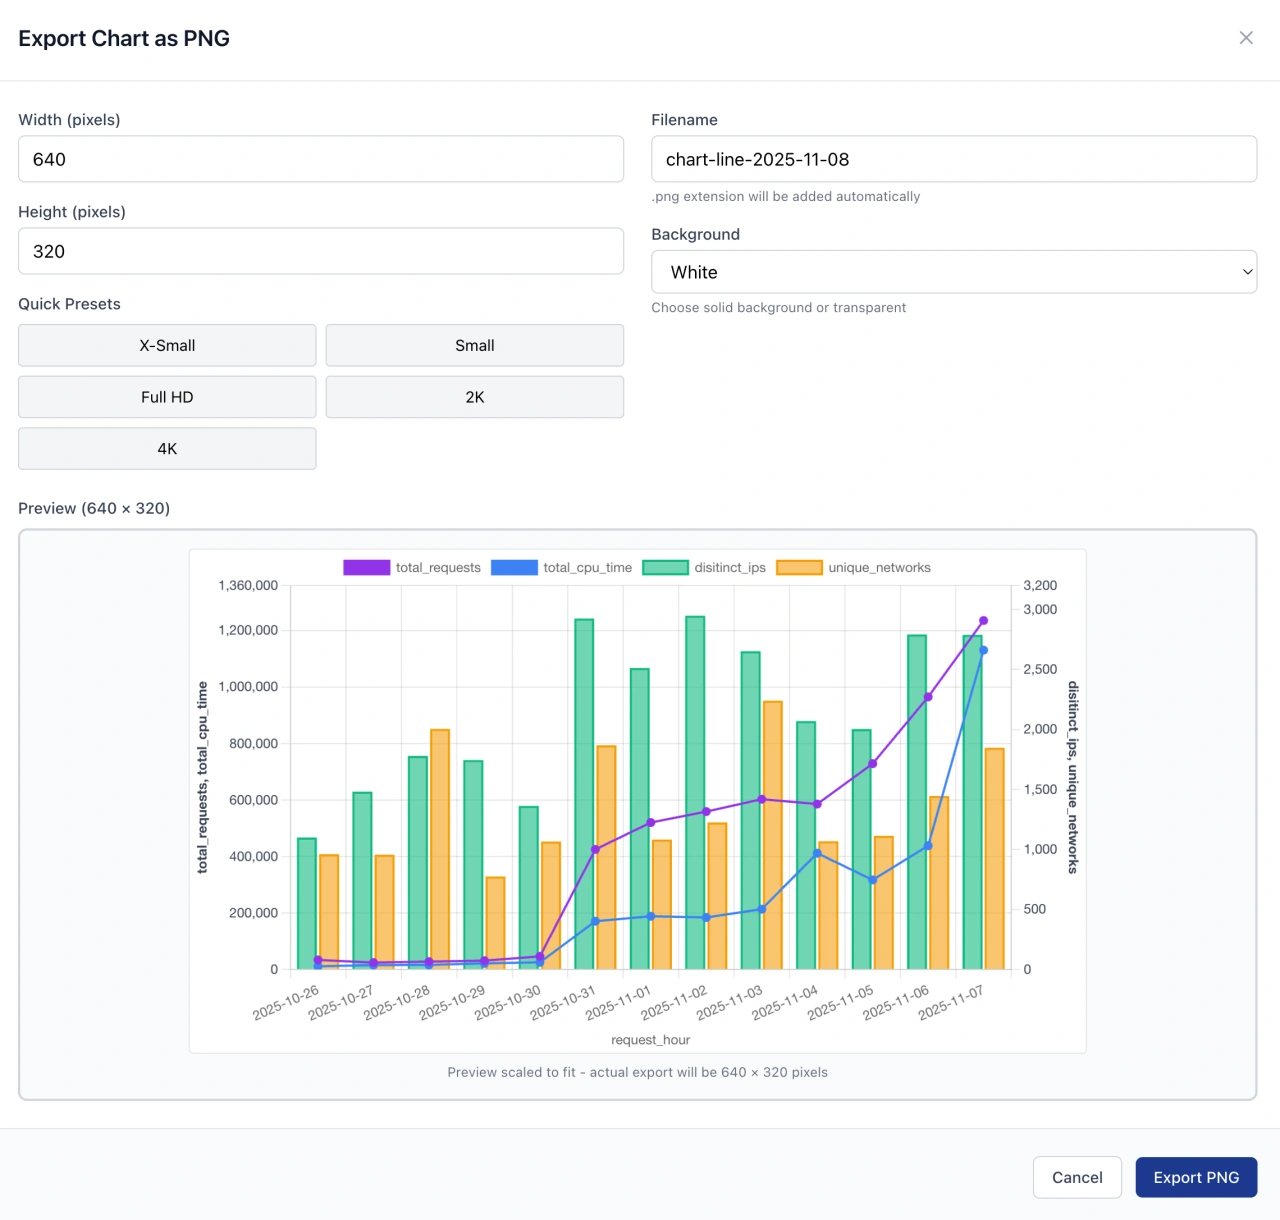
Share Your Work
Export publication-ready charts. From social media thumbnails to 4K presentation slides, we've got you covered. See a live preview before you download.
- PNG export at any resolution (320px to 8K)
- Quick presets: X-Small, Small, Full HD, 2K, 4K
- Custom dimensions—specify exact width and height
- Background options: Transparent, White, Black, and more
- Live preview—see your export before downloading